[Tutorial] How to Use Graph Editor in After Effects

This article is a part of .MEr’s personal experiences and knowledge sharing. We find it crucial to share our community members’ voices and personal stories. So our readers can learn something new, get inspired, and create unforgettable digital experiences. This month, Murilo Almeida, designer and animator, created a tutorial on how to use Graph Editor in After Effects.
So youʼre a motion designer? You know how to add keyframes, do some easing, animate various properties and even some bounce and overshoot scripts? Itʼs a walk in the park, until you get to face the truth. You are afraid to admit that you have a weakness, the mysterious graph editor, the biggest enemy of every After Effects beginner (or pros, even). Just thinking about itʼs existence gives you chills, you even begin to have a mild panic attack.
You see those beautiful, fluid animations and wonder “How the hell do I do that?”. Youʼve tried all kinds of easing, you add keyframes, drag them, add some more, add easing, remove a few, but youʼre never able to replicate exactly right?
If this is you, you’ve come to the right place. Take a deep breath and let’s poke some buttons in the After Effects Graph Editor, it will be a great adventure and in the end, you two will be best friends.
Accessing the Graph Editor
Ok, calm down, grab some tea, focus and hit “Shift + F3”.
If you like your mouse a lot, you can access the graph editor by pressing the button with the graph icon right next to the motion blur button at the top of the timeline panel.
[01 Timeline Top Icons]
Congratulations! You have just opened the After Effects Graph Editor, scared yet?
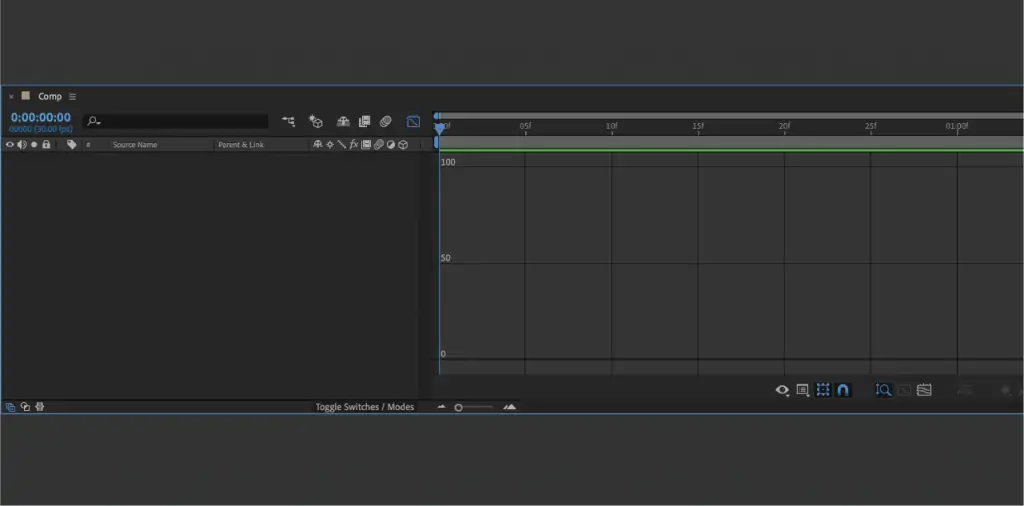
[02 Graph Editor]
If you’re wondering where your layers went, calm down, just press “Shift + F3” again and you will exit the graph editor and go back to the timeline.
The graphics editor is nothing less than a… graph! Ok, thatʼs not really helpful? Its main function is to show how the value of a property will change over time.
“The Graph Editor represents property values using a two-dimensional graph, with composition time represented horizontally (from left to right). In layer bar mode, on the other hand, the time graph represents only the horizontal time element, without showing a graphical, vertical representation of changing values.” – Adobe
Types of Graphs
As if one wasnʼt difficult enough, there are two types of graph, the speed graph and the value graph. Each has unique ways of representing values and being manipulated.
Letʼs use a simple object moving from left to right in 1 second as an example.

[03 Square Example]
This is how the movement is shown inside the graph editor.
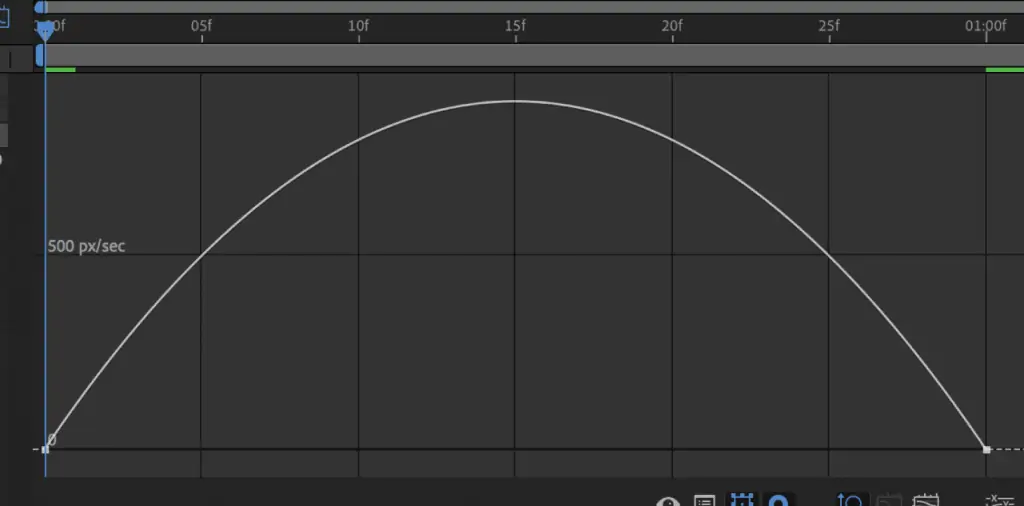
[04 Square Speed Graph]
This graph shows the speed of movement.
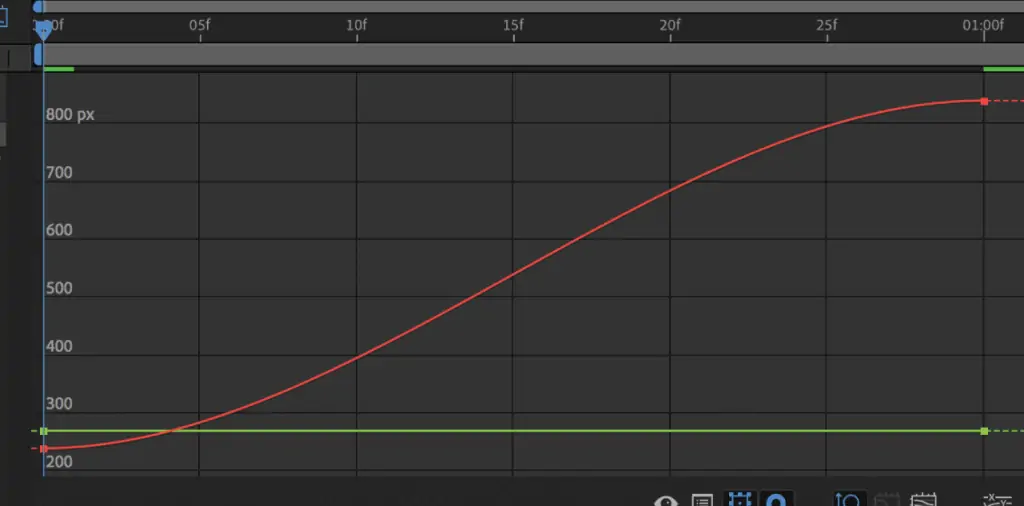
[05 Square Value Graph]
This graph shows the value of the property over time. In this case, it is the position.
At first glance, the graphs arenʼt very intuitive, but once you learn how to interpret them your life will change so much that you will be wondering how you lived until today without knowing how to use the graph editor (not kidding). Oh, and to switch between Speed and Value graphs, just press the second button at the bottom of the graph panel, on the right side of the button with an eye icon and choose “Edit Value Graph” or “Edit Speed Graph”.
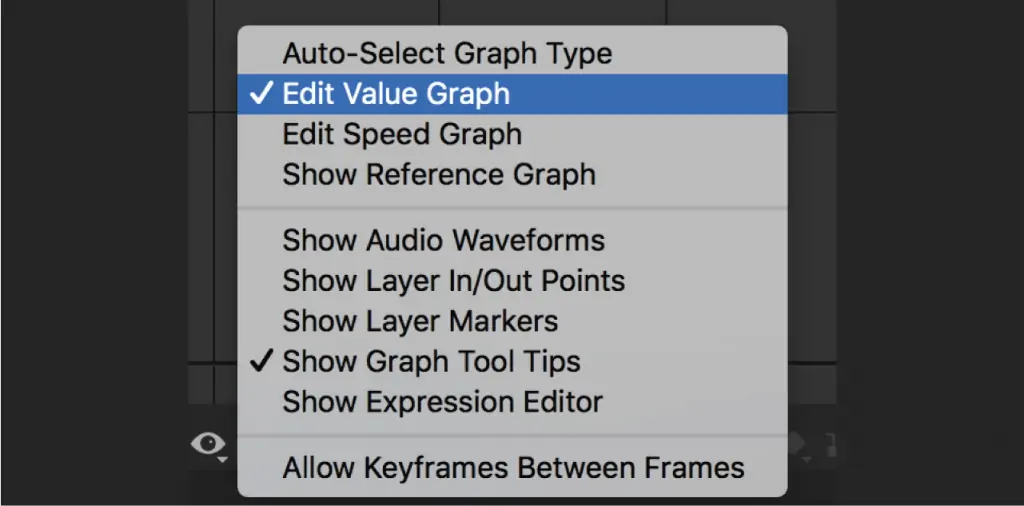
[06 Change Graph Menu]
Why Use the Graph Editor
The default keyframes easing values are hardly what you need. If you intend to bring life to your animation, you need a lot more control over what happens between the keyframes.
A ball bouncing, a ball overshooting, a ball… balling. Having precise control of what a ball (or any other object) does is only possible with the graph editor.

[07 Bouncing Ball Example]

[08 Ball Speed Graph]

[09 Ball Value Graph]
This example of a bouncing ball is only easily achievable by directly manipulating the graph.
How to Read Each Graph
To make things a bit less difficult to understand, let’s go back to the example of the moving object.
Speed Graph
In the speed graph, the vertical axis displays the speed of the object in pixels per second px/sec. This means that the higher the value on the vertical axis is, the faster the object is moving.
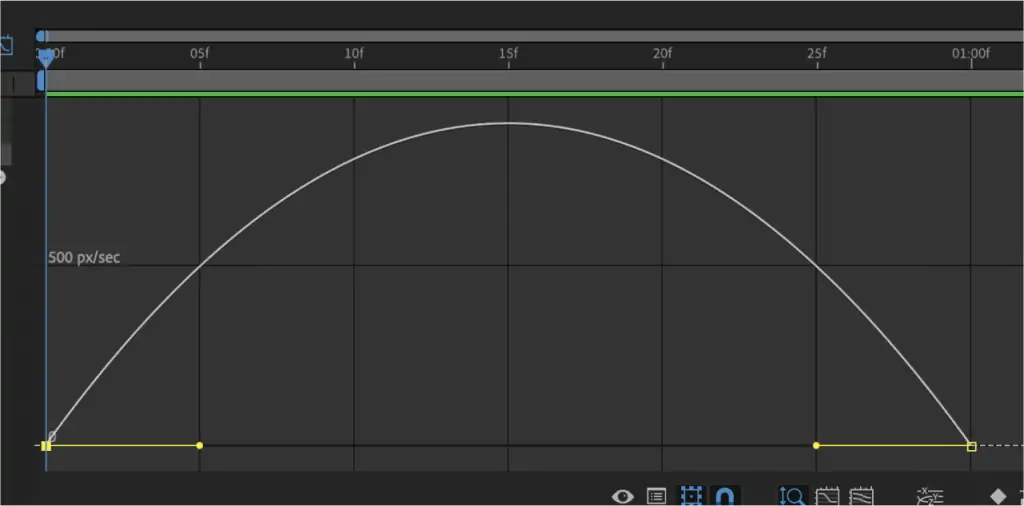
[10 Speed Graph]
In the first frame, the speed is zero, it speeds up until it reaches a peak of 900 pixels per second at 15 frames and then slows down to zero again.
Taking a second look at the full graph, we can notice that the horizontal axis is just the frames of the timeline and the vertical axis is speed.
To manipulate the speed, you need to change the influence of the keyframe, you can do that by dragging one of the anchors.

[11 Modified Speed Graph Example]

[12 Modified Speed Graph]
If you don’t see any anchors, just select the keyframes and press “F9” to add an Easy Ease. You can also do it using the menu by going to “Animation > Keyframe Assistant > Easy Ease”.
Value Graph
Here things start to get much more interesting. In the value graph, the vertical axis represents the property’s value according to time.
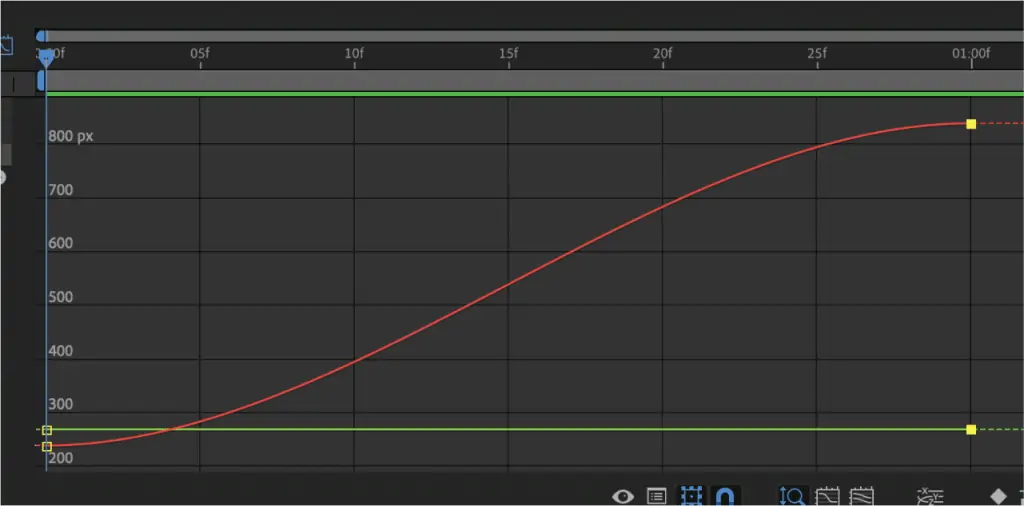
[13 Value Graph]
The magic of the value graph is that we can manipulate the anchors in any direction.
By default, it is not possible to do that with the position property. In order to enable this wonderful feature, first, we need to separate the position dimensions. To do this, right-click on the position property and select the item “Separate Dimensions”.
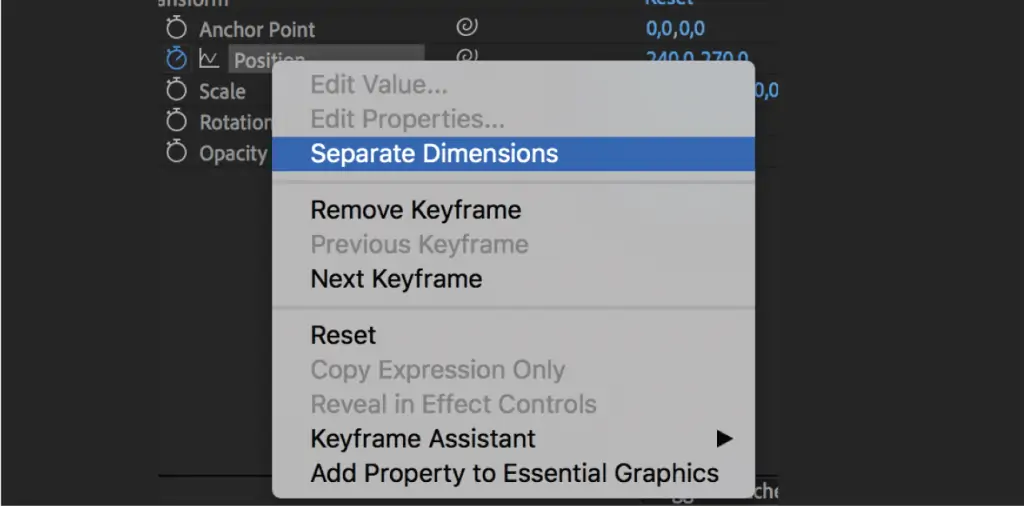
[14 Separate Dimensions]
Now we can do whatever we want with them, we can do any kind of adjustment and any type of acceleration and deceleration, we can even add more keyframes for even more detailed movements.

[15 Modified Value Graph Example]
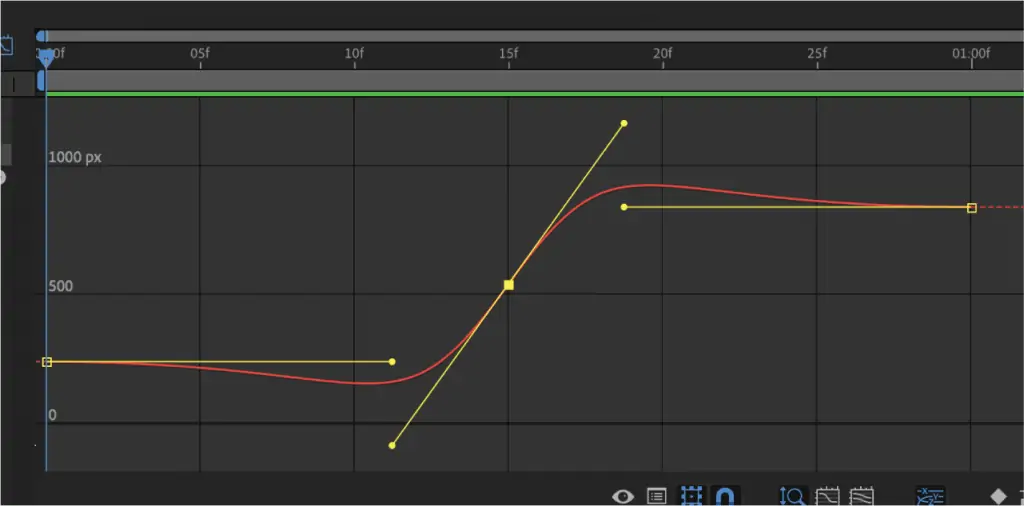
[16 Modified Value Graph]
Editing Values by Hand
If you are one of those who can’t stand letting the TV volume at 49 or 51 or youʼre a psychopath that wants your curves to be mathematically symmetrical (like me), you can go even deeper.
Select one of the keyframes on the graph and press “Control / Command + Shift + K”. Congratulations, you have just unlocked the secret “Keyframe Velocity” menu!

[17 Keyframes Velocity Window]
Ok, it is not that secret, you can also access it by right-clicking on a keyframe on the timeline or graph and selecting “Keyframe Velocity…”
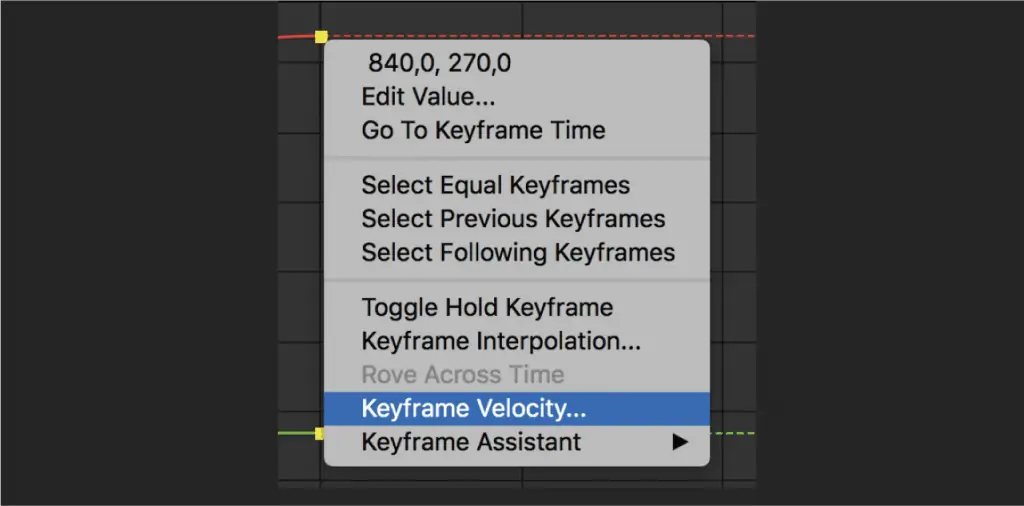
[18 Keyframes Velocity Menu]
Here you can manually enter the input and output values for the speed and influence of the keyframe.
Now you can go put your mind at ease knowing that all your keyframes are whole.
Okay, now what?
Now that you are a graph editor wizard, your life (and your curves) will never be the same.
Alright, thatʼs a lie, this is just the beginning, you may still get chills when opening the graph editor, but now you know a bit more of what any of those lines mean.
Now it’s up to you, you can download the project file used for this tutorial to dive deeper, and whenever you can, try to use the graph editor, with time you will start to get the hang of it and soon you will forget how was to live without knowing it.